

https://xroute.ai/personal/call) provides real-time operational analytics and end-to-end audit observability across all API traffic routed through XRoute.
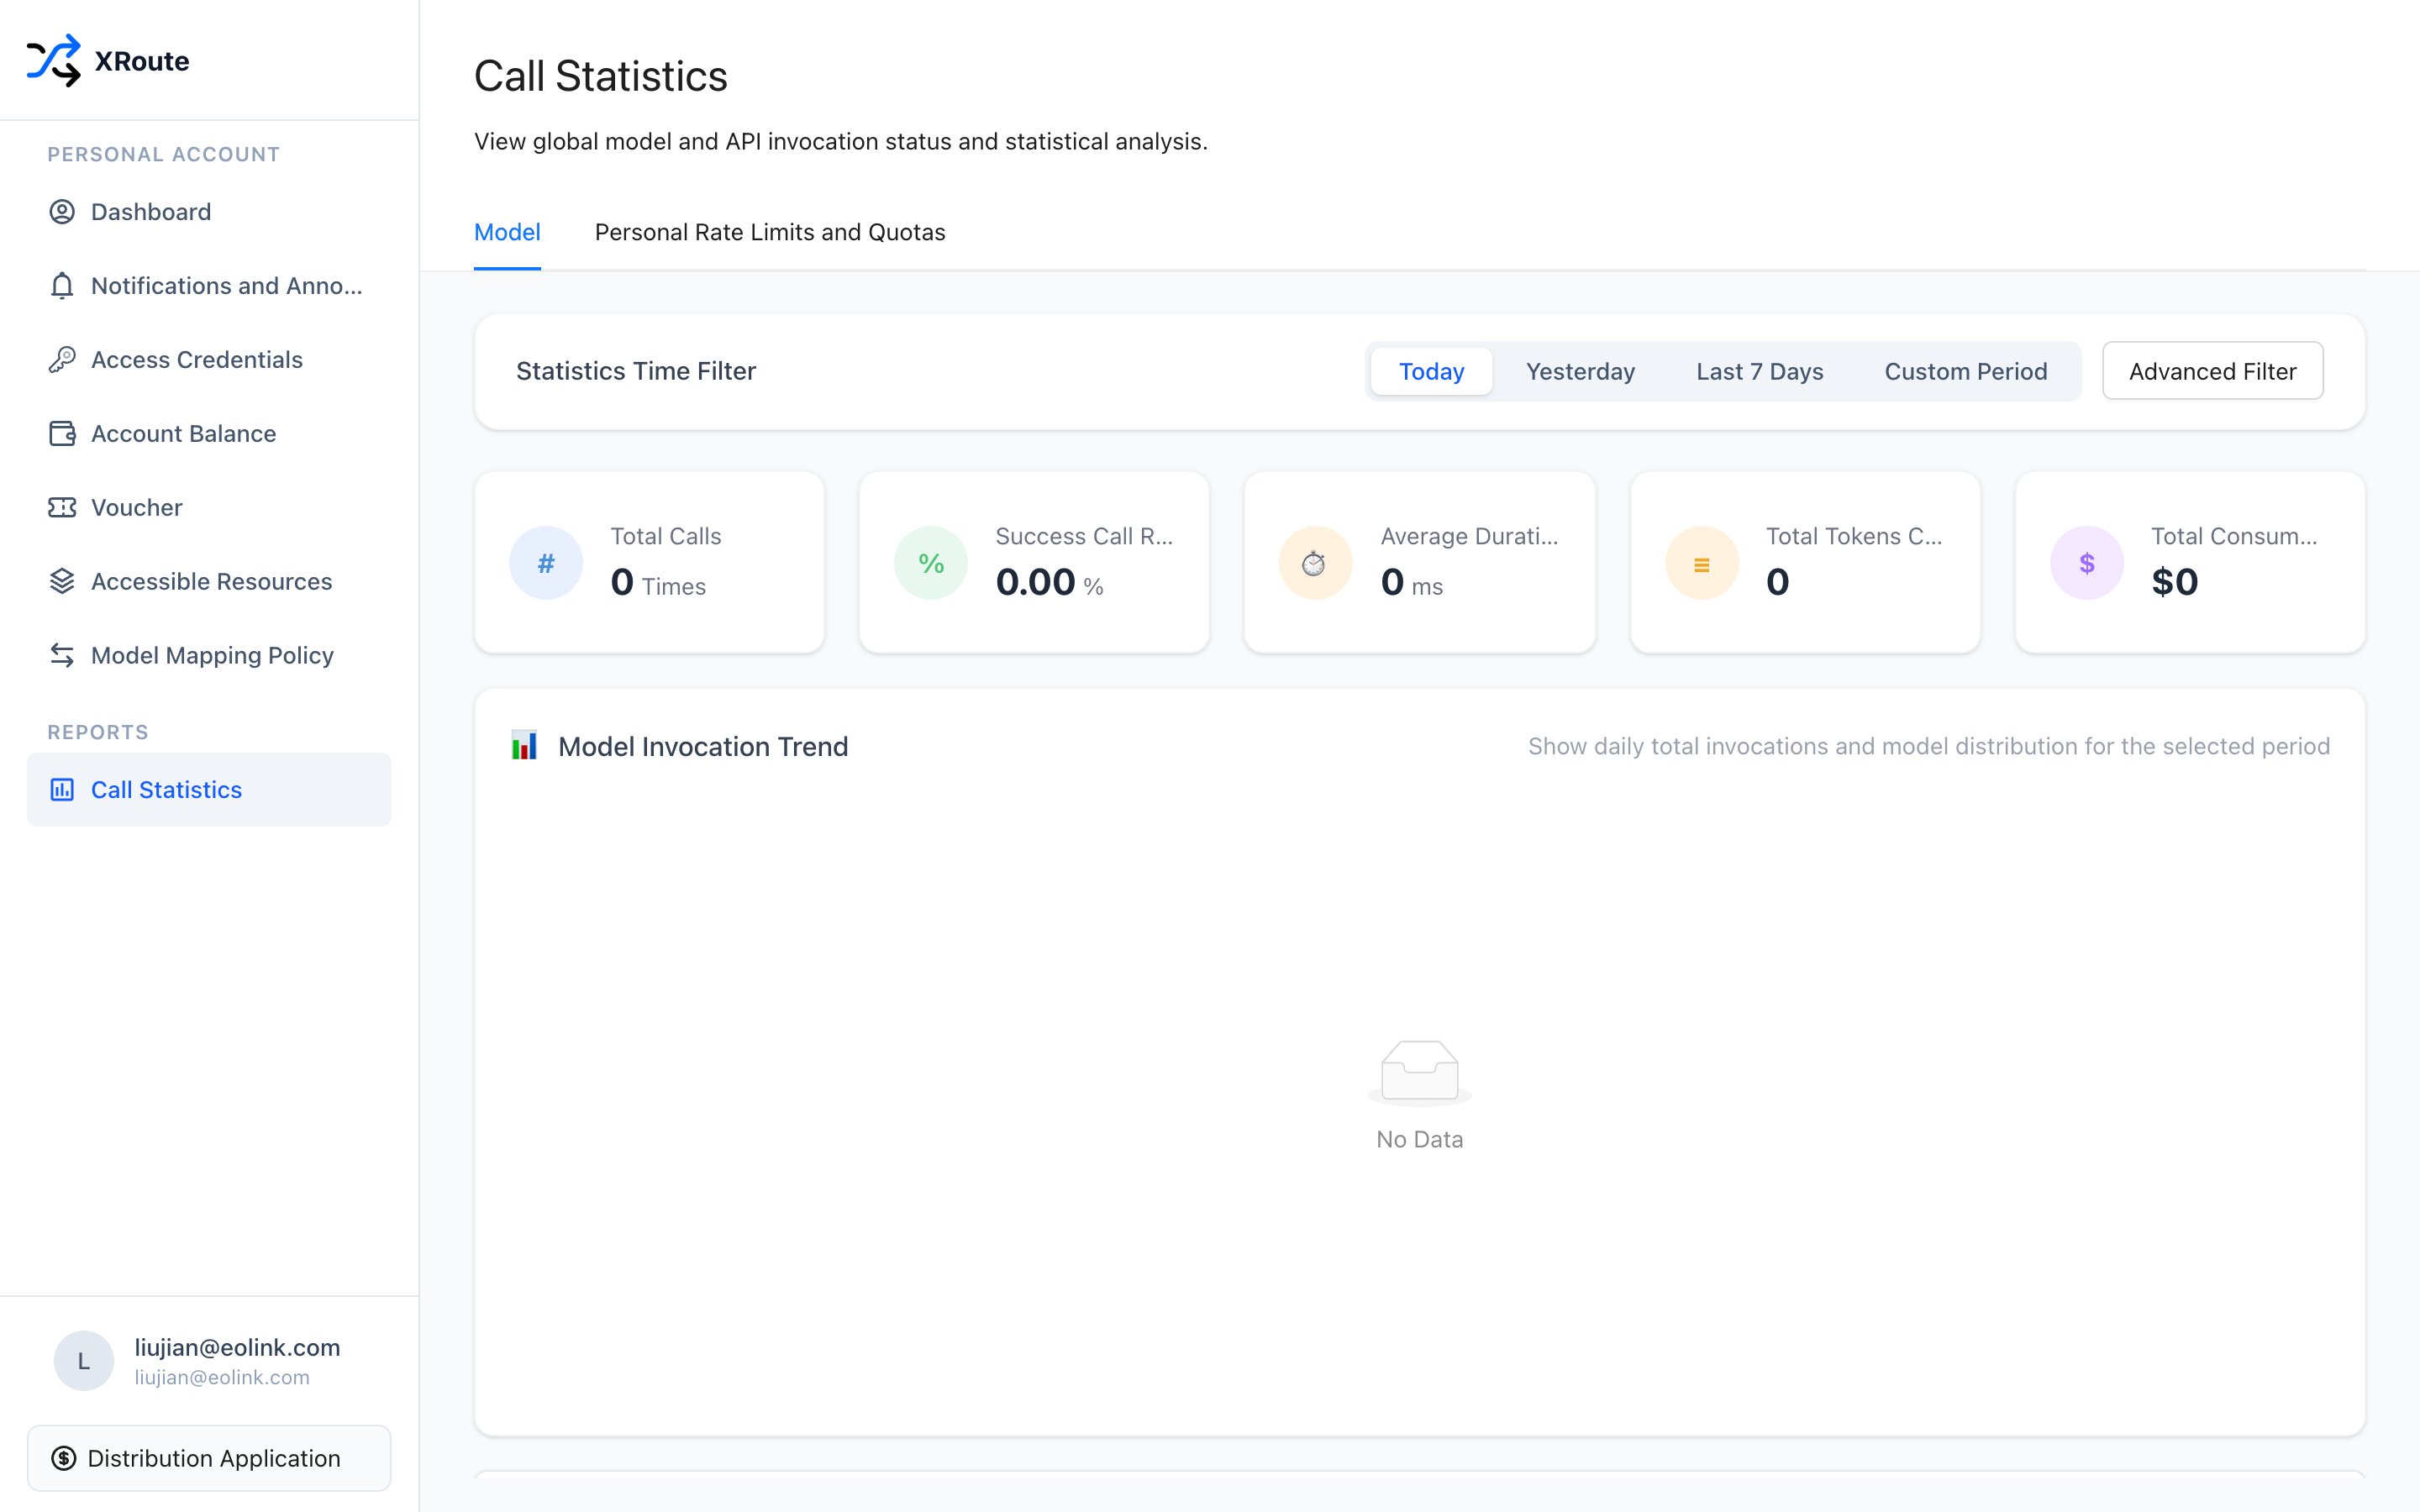
XRoute Call Statistics analytics, invocation trends, and per-request audit logs
Date & Filter Controls
At the top of the analytics dashboard, adjust the scope of your inspection:- Quick Presets: Today, Yesterday, Last 7 Days, or Custom Period (custom date and time boundaries).
- Personal Rate Limits and Quotas: Review your current concurrency caps and queries-per-minute (QPM) thresholds.
- Advanced Filter: Drill down by specific Provider, Model, Status Code (e.g. 200, 429, 500), or Credential Key.
High-Level Metric Tiles
Five high-level summary cards provide instant performance feedback:- Total Calls: Aggregated count of API requests during the selected period.
- Success Call Rate: Percentage of requests successfully fulfilled with HTTP 200.
- Average Duration: End-to-end response latency (in milliseconds or seconds).
- Total Tokens Called: Combined sum of input prompt tokens and output completion tokens.
- Total Consumption Amount: Net settled financial cost (in USD) incurred by calls during the period.
Model Invocation Trend
The interactive line and area charts plot your traffic volume over time:- Compare multi-day invocation trajectories.
- Inspect the proportional traffic distribution across different models (e.g., Anthropic vs. OpenAI vs. DeepSeek).