

https://xroute.ai/personal/dashboard) is the landing page of the XRoute Console, offering an immediate operational pulse of your AI gateway account.
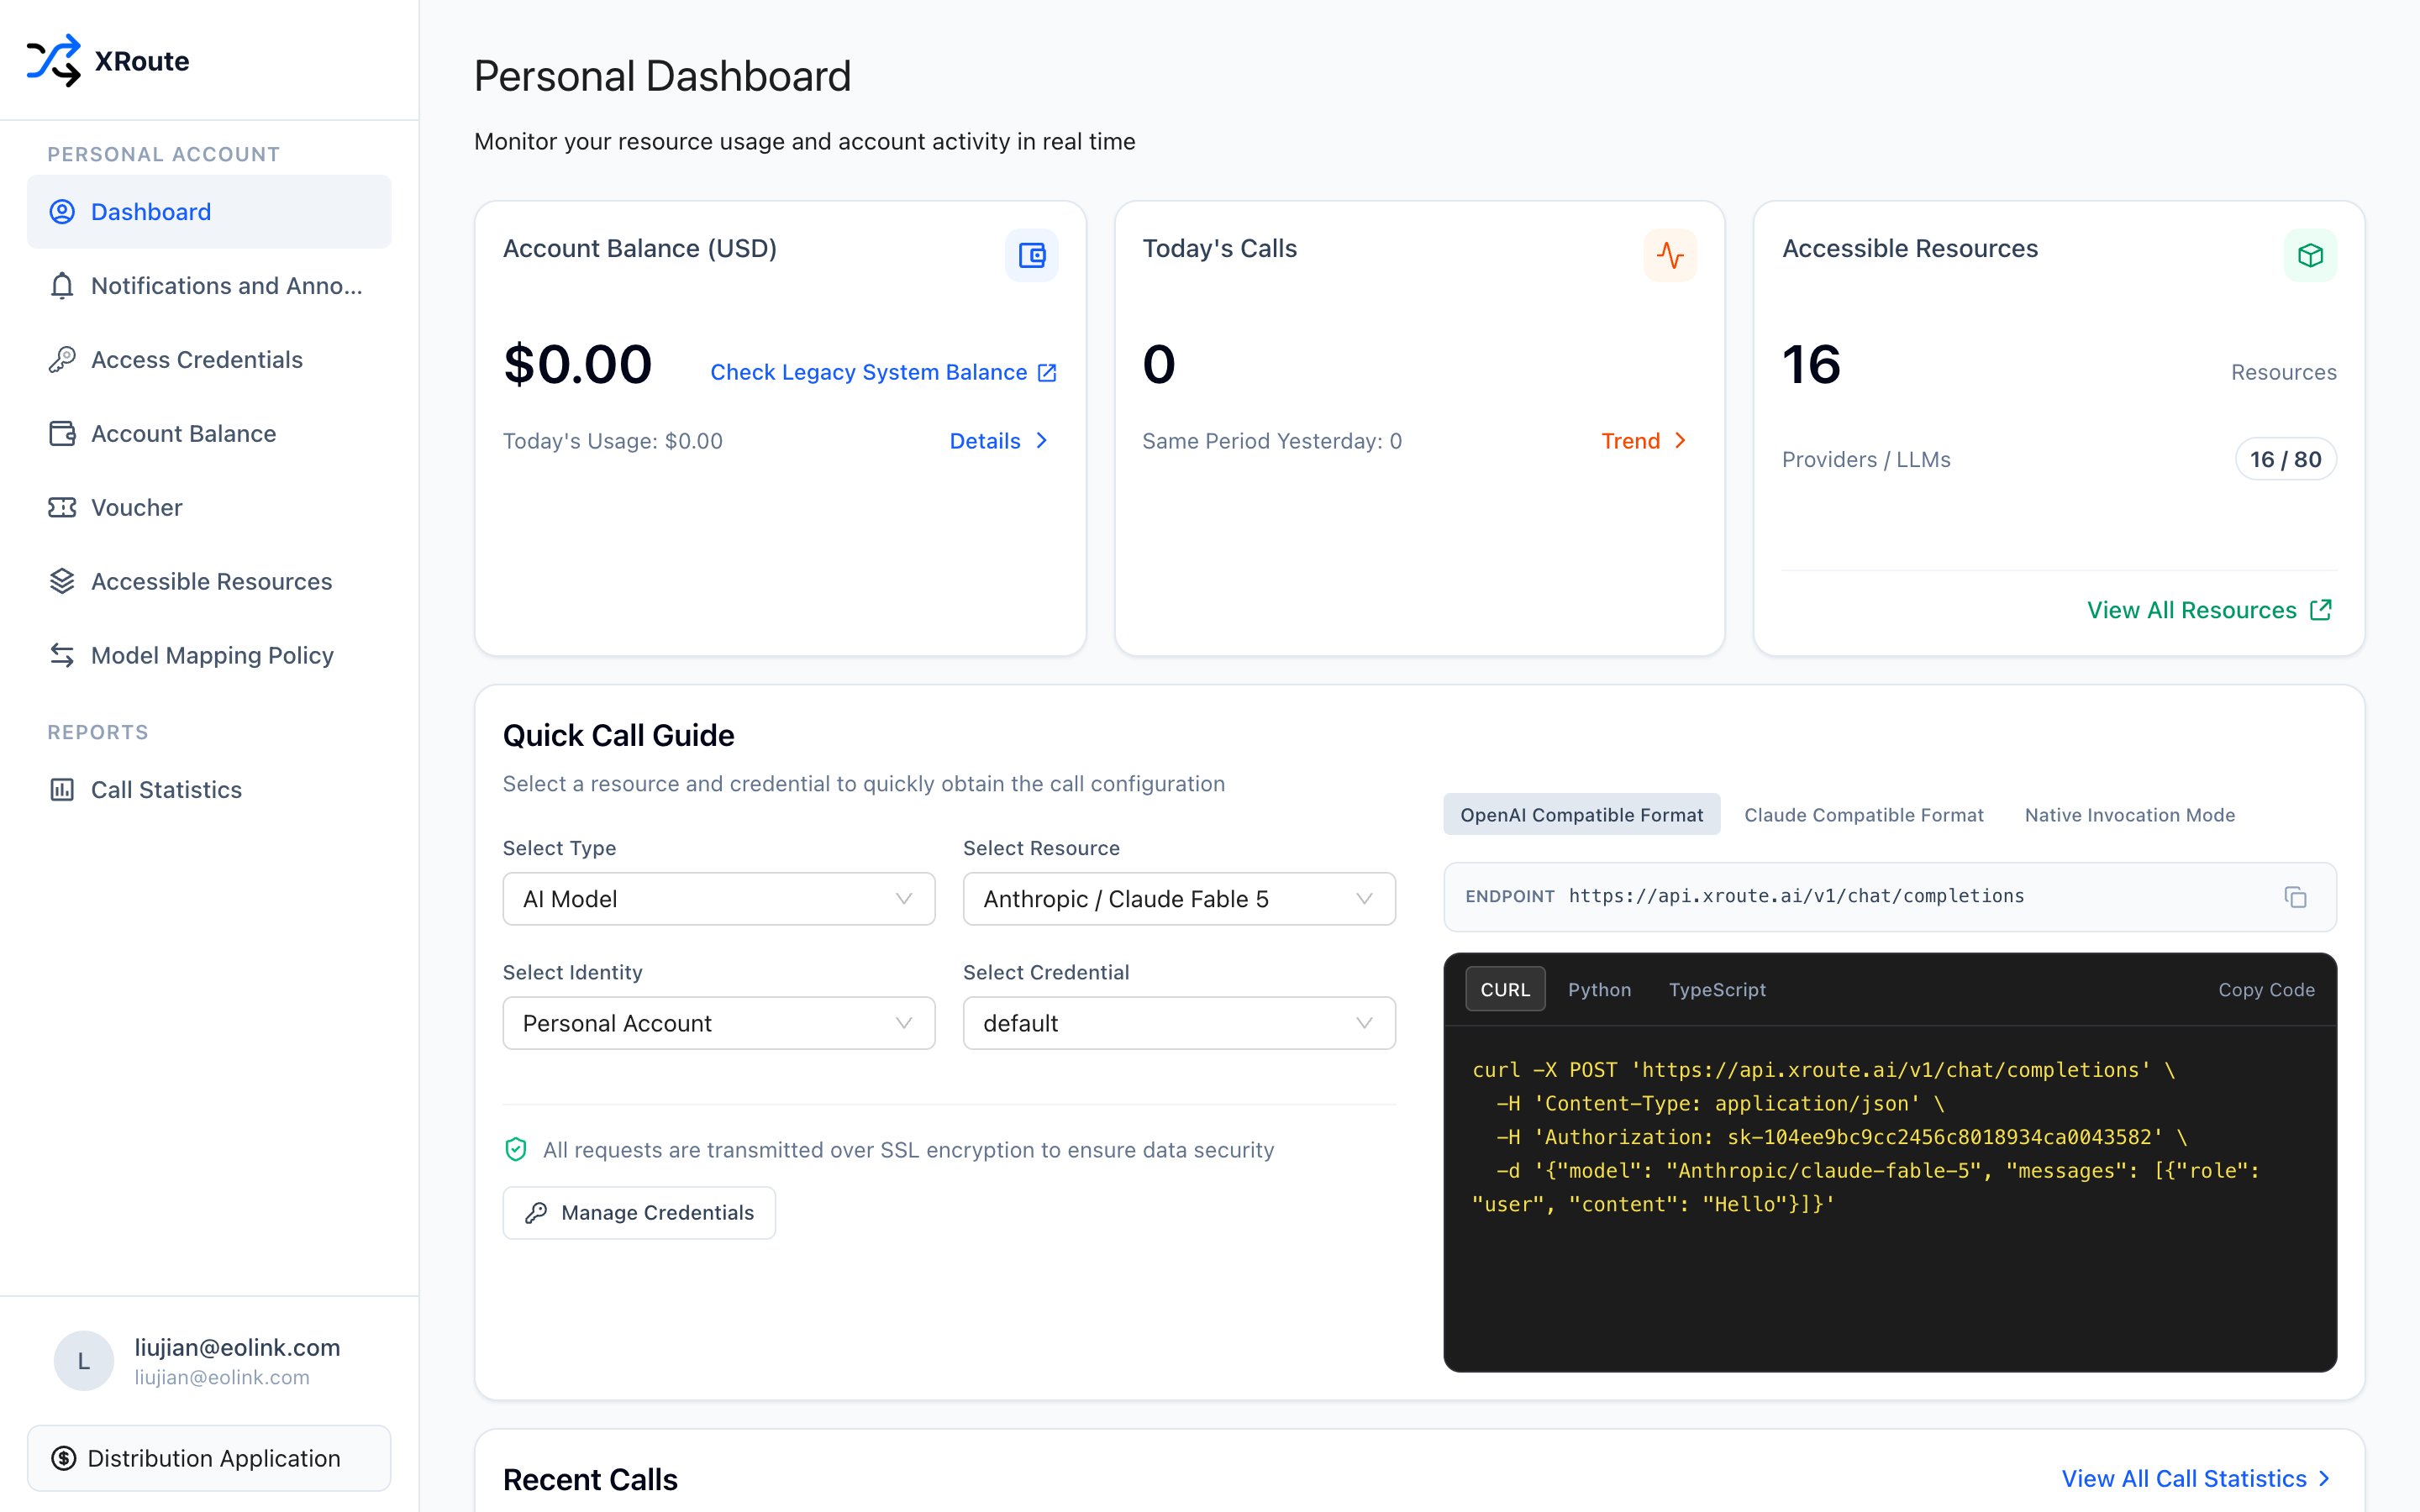
XRoute Personal Dashboard with live balance, quick call snippets, and recent invocations
Key Metric Cards
At the top of the dashboard, four metric cards display your vital account stats:- Account Balance (USD): Shows your real-time available cash balance. Click Details to jump to your full balance statement or top up.
- Today’s Usage: Shows the net settled dollar amount consumed today.
- Today’s Calls: Shows the total number of API requests processed today, alongside a comparison with the same period yesterday. Click Trend to open historical charts.
- Accessible Resources: Shows the total count of AI models available to your account (e.g.
16 / 80providers/LLMs). Click View All Resources to browse available models.
Quick Call Guide
The Quick Call Guide enables developers to test models immediately without writing boilerplate code or manually piecing together tokens and headers:1
Select Type & Resource
Choose AI Model under Type, then select your desired model from the dropdown (e.g.,
Anthropic / Claude Fable 5, OpenAI / gpt-6-astra, DeepSeek / DeepSeek-V3).2
Select Identity & Credential
Select Personal Account and pick the target credential key (e.g.,
default).3
Choose Protocol Format
Switch between three standardized invocation protocols:
- OpenAI Compatible Format: Standard
https://api.xroute.ai/v1/chat/completionsendpoint compatible with standard OpenAI SDKs. - Claude Compatible Format: Standard
https://api.xroute.ai/v1/messagesendpoint compatible with Anthropic SDKs. - Native Invocation Mode: Direct provider-specific formats (including native image generation and async video tasks).
4
Copy and Execute
Select your preferred programming language (CURL, Python, or TypeScript), click Copy Code, and paste the command into your terminal to run immediately.
Ready-to-run cURL generated by Quick Call Guide
Recent Calls
The bottom section of the Dashboard displays the 10 most recent resource invocations with exhaustive technical and billing data:
Click View All Call Statistics in the top right of the table to open the full Call Statistics report.